Learn, reproduce and share
Created by Brian Chen

Open scholarship, from data to public impact.

Learn how to work with social determinants of health data, build a reproducible analysis in R, create interactive Tableau visualizations, and share your work openly.

3connected toolkit parts
8unique public data sources
7numbered R scripts
FAIRopen scholarship framework
Open Research Toolkit

Learn with the Toolkit

Move through three connected modules, from understanding the data to analyzing it and sharing your work openly. Each module is presented as its own learning page while still belonging to one connected sequence.

Video Learning Library

Watch the workflow in action

Use the demonstrations as you move through the toolkit, from connecting data to publishing and sharing the final project.

Access Tableau

Create or sign in to Tableau Public and access the web authoring environment.

Connect Your Data

Upload and connect the prepared project data to Tableau Public.

All Maps: Asset Maps

Reference mapping for geographic units and community-resource locations.

All Maps: Thematic Maps

Open the thematic-mapping section of the toolkit demonstration.

Assemble Your Dashboard

Combine coordinated maps and charts into an interactive dashboard canvas.

Story Map

Arrange views into a guided research narrative with multiple story points.

Adapt and Share

Adapt an existing project and publish or share the resulting Tableau work.

Make GitHub Citable with Zenodo

Connect a GitHub release to Zenodo for a DOI.

Student Showcase

Open Scholarship Example Library

Student fellows apply the toolkit to build reproducible workflows and Tableau visualizations. Projects are shown as dashboard screenshot previews, with the newest featured example highlighted in a full-width row. Open the full interactive dashboard when you want to explore the maps, charts, filters, and details.

Featured student example 01

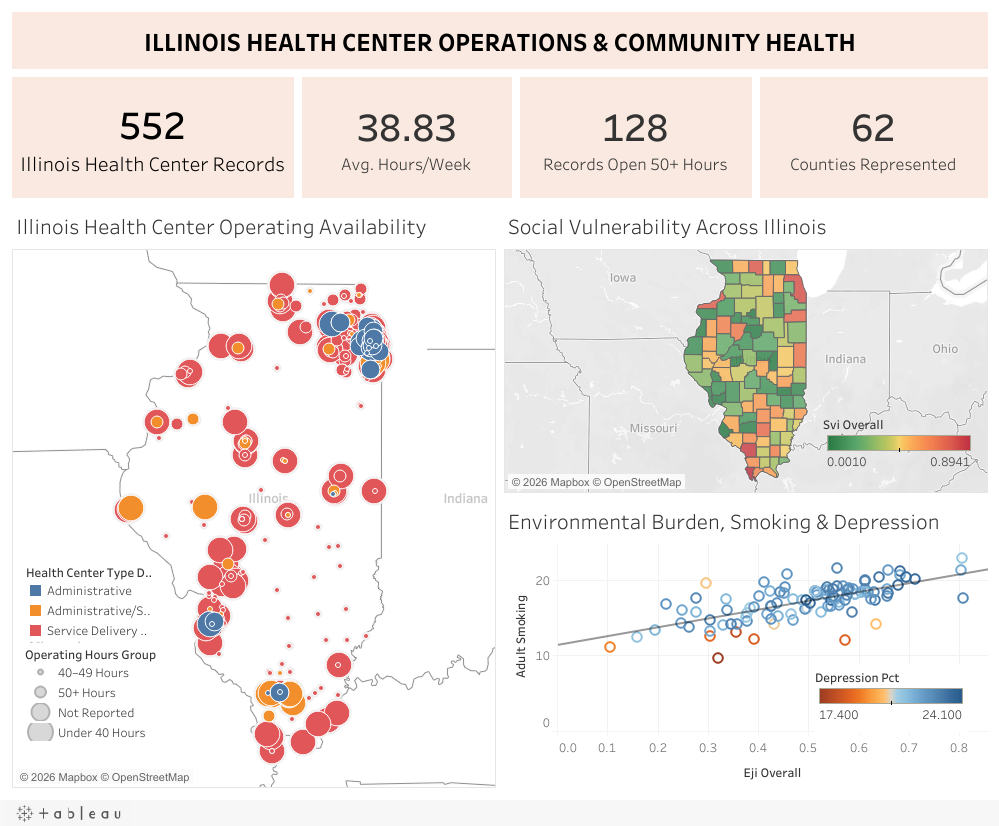
Illinois Health Center Operations & Community Health

Research question: How are health center locations and operating hours distributed across Illinois, and how do county-level vulnerability and health indicators vary across the state?

Preview of the Illinois Health Center Operations and Community Health dashboard Open Interactive Dashboard

Explore health center operations, community vulnerability, and selected health indicators across Illinois.

Featured student example 02

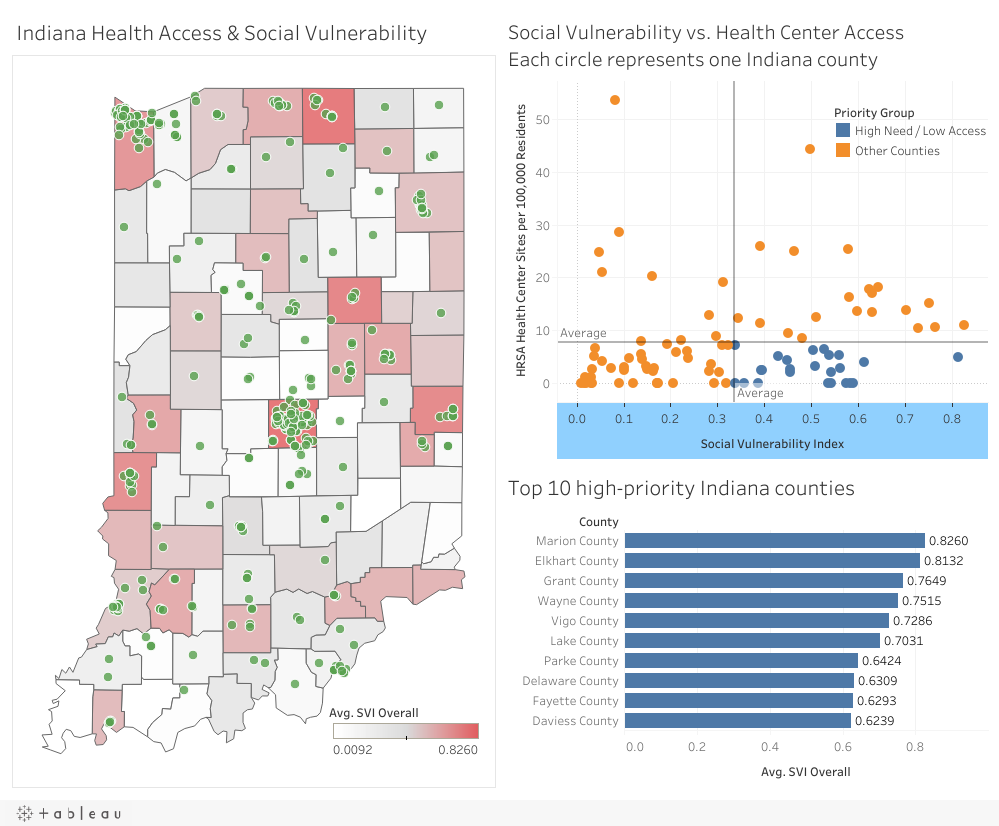
Indiana Healthcare Access Dashboard

Research question: Which Indiana counties experience higher social vulnerability and relatively lower access to HRSA health centers?

Preview of the Indiana Healthcare Access dashboard Open Interactive Dashboard

Explore social vulnerability and access to HRSA health centers across Indiana.

Featured student example 03

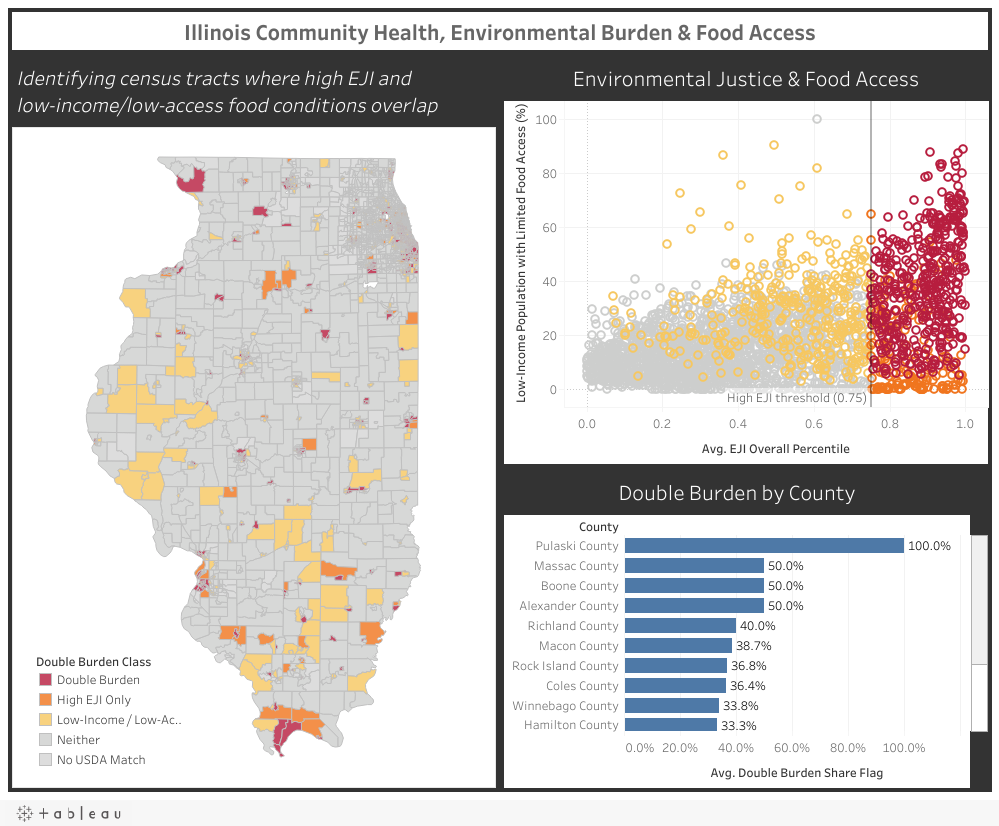
Illinois Environmental Burden & Food Access Dashboard

Research question: Where do high environmental burden and low-income, low-access food conditions overlap across Illinois census tracts, and which counties have the greatest concentration of these double-burden communities?

Preview of the Illinois Environmental Burden and Food Access dashboard Open Interactive Dashboard

Explore environmental burden and low-income, low-access food conditions at the Illinois census-tract level.

Featured student example 04

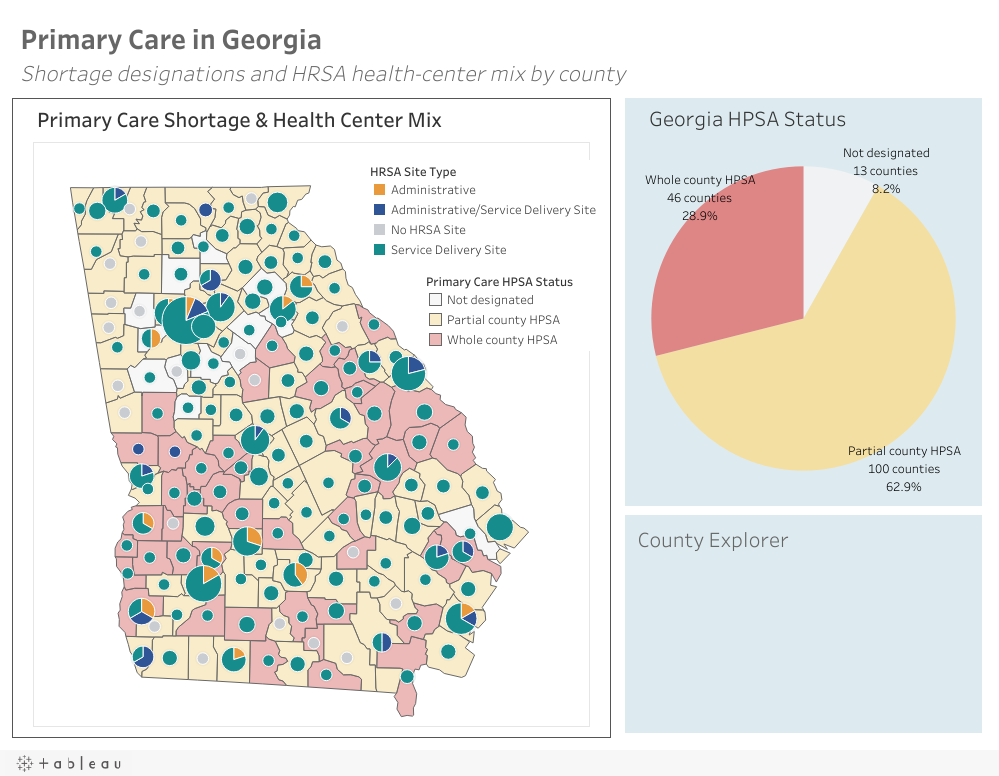
Primary Care in Georgia

Research question: How do primary care shortage designations and the mix of HRSA health-center resources vary across Georgia counties?

Preview of the Primary Care in Georgia dashboard Open Interactive Dashboard

Explore primary care shortage designations, health-center mix, and selected county health indicators across Georgia.

Workflow

From research question to open scholarship

Follow a consistent sequence from choosing a research question to publishing a reproducible, citable project.

STEP 1Ask a QuestionChoose an SDOH topic, location, population, and outcome.
STEP 2Get the DataDownload public data and document its source and date.
STEP 3Analyze in RClean, merge, analyze, and document your workflow.
STEP 4Visualize in TableauBuild maps and interactive views that communicate your findings.
STEP 5Share & CitePublish through GitHub and use appropriate repositories or persistent identifiers.

Open scholarship in practice

Build research that others can find, access, understand, reproduce, and reuse.

F

Findable

Make your work discoverable through GitHub and, when appropriate, a repository record or persistent identifier.

A

Accessible

Share data, code, and visualizations through openly accessible platforms and formats.

I

Interoperable

Use standard identifiers, consistent variables, and open file formats.

R

Reusable

Document code, data sources, methods, and project files so others can build on the work.

Resources

Toolkit Resources

Access the complete learning toolkit and the reproducible project resources that support the learning experience.

Complete Toolkit

View all three parts together, including the full table of contents and the complete learning sequence.

Open Toolkit Folder →

GitHub Project

Explore the R scripts, documentation, project data, data dictionary, and reproducible workflow.

Open GitHub Project →

Canvas Module

Access the Canvas learning module resources for importing and adapting the Open Research Toolkit in Canvas.

Open Canvas Module →

This project has been made possible in part by grant 2024-349547 from the Chan Zuckerberg Initiative DAF, an advised fund of the Silicon Valley Community Foundation.